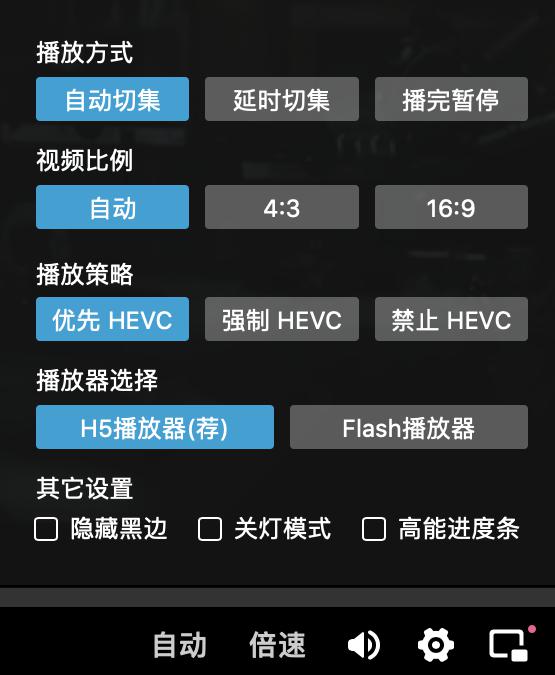
参考 B 站技术中心的专栏,有提到会在原生支持 HEVC 的浏览器上测试(现在也只有 Safari 了),目前已经上线。

P.S. 直播也支持 HEVC 编码了,选择“蓝光+”或“超清+”可体验。
]]>date -d @<seconds>date -r <seconds>
]]>find / -xdev -printf '%h\n' | sort | uniq -c | sort -k1 -nr | head%h 可以输出父目录的路径,配合 sort 和 uniq 可以找出 inode 占用问题的元凶。
jq -s '.[0] + .[1]' stub.json cfg.json
]]>修改 /etc/docker/daemon.json,配置 data-root 参数即可。
https://docs.docker.com/config/daemon/#docker-daemon-directory
]]>The Docker daemon persists all data in a single directory. This tracks everything related to Docker, including containers, images, volumes, service definition, and secrets.
By default this directory is:
/var/lib/dockeron Linux.C:\ProgramData\dockeron Windows.You can configure the Docker daemon to use a different directory, using the
data-rootconfiguration option.
Library/ApplicationSupport 这个软链接指向 Library/Application Support。排查一番发现是 iTerm2 搞的鬼。iTerm2 creates the ApplicationSupport symlink to Application Support because shell scripts may not have spaces in their paths and the pip utiltiy does not work correctly in directories with spaces.]]>
import ipaddress
list(map(str, ipaddress.ip_network('10.0.0.0/24').subnets(new_prefix=25)))Prometheus 提供了一个强大的内置函数 increase() 可以自适应 counter 的重置和丢点。在 Grafana 上选择 Stat 可视化,计算方式选择 Total,配合 increase 使用就可以计算一个预估的变化量了。
但 increase() 函数是需要一个 range-vector 参数的。Grafana 自带的代码补全提示有 $__interval、$__rate_interval 这两个变量,哪个更适合计算变化量呢?结论是,直接使用都不适合。原因参考这篇 $__rate_interval 的介绍文章。
$__rate_interval 适合曲线图展示的 rate(),可以利用 moving average 提供一个更细粒度的增速预估。但由于它的值是不固定的且一定大于 $__interval,在 Grafana 中我们又是按每个 $__interval 计算 increase() 的值求和的,导致总和会计算进 $__rate_interval - $__interval 这部分多余的时间。
$__rate_interval: max($__interval + Scrape interval, 4 * Scrape interval)那么是不是直接用 $__interval 作为 range-vector 就可以了呢?并不。从上面那篇文章可以看出为了计算出准确的 rate() 或 increase(),参数里的时间范围至少要是采样间隔的4倍。所以我们还需要配置 Min step 为 Scrape interval * 4,大功告成。
参考 B 站技术中心的专栏,有提到会在原生支持 HEVC 的浏览器上测试(现在也只有 Safari 了),目前已经上线。

P.S. 直播也支持 HEVC 编码了,选择“蓝光+”或“超清+”可体验。
]]>